How Conservative
macroeconomic policy may be making us persistently poorer
I was happy to sign
a letter
from mainly academic economists published in the Observer yesterday,
supporting the overall direction of Labour’s macroeconomic policy.
I would also have been happy to sign something from the Liberal
Democrats, who with a similar macroeconomic stance have the added
advantage of being against Brexit, but no such letter exists. As I
have said before about letters, it is the overall message that
counts. We desperately need more public investment and more current
spending to boost demand, which in turn will allow interest rates to
come away from their lower bound.
If I could carry
just one message into mediamacro to bring it more into line with
macro theory, it is that nominal interest at their lower bound
represent a policy failure. Unconventional monetary policy is a very
unreliable substitute for interest rate changes and fiscal policy as
a way of controlling the economy, and a temporary fiscal stimulus can
reliably get interest rates off their lower bound. This was the big
mistake that most advanced countries made in 2010, and painfully slow
recoveries were the result. The UK is currently making the same
mistake, which is why the macroeconomic impact of the Labour and
LibDem programmes is so much better than the Conservatives’
continuing austerity.
In the textbook
macroeconomic models, this policy mistake can have a large but
temporary cost in terms of lost output and lower living standards.
This is because in these basic models a short term lack of demand
does not have an impact on supply. Output in the longer run
is determined by the number of those wanting to work, the capital
stock and technology, all three of which are assumed to be
independent of short term demand shortages. However it looks
increasingly like these textbook models can be wrong.
In a new study
(pdf),
Gustav Horn and colleagues at the IMK institute in Germany looked at
how persistent the impact of negative fiscal shocks (higher taxes or
lower spending) had been on output. Their analysis is a refinement of
earlier studies by of Blanchard
and Leigh, and more recently Fatas
and Summers. They find that the impact of recent
fiscal shocks have been persistent rather than temporary, at least so
far.
Although this
persistent impact is not part of textbook models, economists have
explored effects of this kind (the collective name for which is
‘hysteresis’). There are many theories about why it could happen, such as theories of endogenous growth. I explored the idea of an innovations gap in a
recent post.
To see why this possibility is so important, take the example of UK
austerity in financial years 2010/11 and 2011/12. A few years ago I took
the OBR’s (conservative) assessment
of its impact on GDP growth in those two years, and assumed that the
impact of fiscal consolidation had completely unwound by 2013. That
gave you a total cumulated cost of austerity of 5% of GDP (1+2+2), or
£4,000 per household.
What happens if
instead the impact of austerity is much more persistent? I can no
longer use the OBR’s numbers, because they assume impacts die out
over time. Instead, let me make the fairly conservative assumption
that each 1% reduction in the cyclically adjusted deficit reduces GDP
by 0.7%, but these effects are permanent. I’ve chosen 0.7 because that gives a similar
answer for the cost of austerity by 2012 as my previous calculation.
But rather than disappearing in 2013, these cost persist and grow
with each additional act of consolidation. By 2016/17
GDP would be lower by nearly 4%, and a further 1% would be added by
the planned additional austerity until 2019/20. If you accumulate
those losses, it means that the average household would have lost a
staggering £13,000 by 2016/17, rising to £23,000 3 years later.
If you think that
sounds a ridiculously large number, just compare output or income
relative to past trends. Here is a version from the IFS.
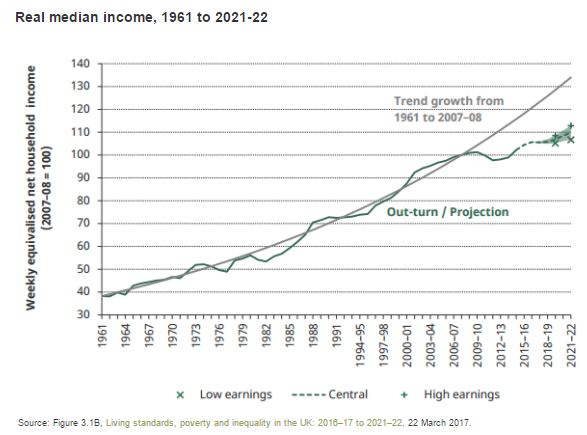
Once you see this
data, claims that we have a strong economy become laughable. UK
median incomes are currently over 15% below previous trends. That is
more than enough room to accommodate 4% due to a permanent effect
from austerity.
I do not have to
argue that such permanent effects are certain to have
occurred. The numbers are so large that all I need is to attach a
non-negligible probability to this possibility. Once you do that it
means we should avoid austerity at all costs. In 2010 austerity was
justified by imagined bond market panics, but no one is suggesting
that today. The only way to describe current Conservative policy is
pre-Keynesian nonsense, and incredibly harmful nonsense at that. That
was why I signed the letter.
“We desperately need…more current spending to boost demand..” Whaat? Inflation is already at or above the 2% target, isn't? If SW-L has now abandoned the 2% target, I suggest he should explain why.
ReplyDeleteNext, in his second para, SW-L argues that fiscal stimulus is a reliable way of getting interest rates “off their lower bound”. Well I agree that fiscal stimulus is a reliable way of raising demand, which cuts unemployment and solves the basic problem (assuming, contrary to my above paragraph, there is scope for raising demand). Why then the ADDITIONAL objective of artificially interfering with interest rates?
The optimum, or GDP maximising rate of interest is presumably the free market rate. Why interfere with it? Moreover, according the Bank of England, interest rate adjustments do not work particularly quickly: in fact according to the BoE they take a full year to work.
The claim that the optimum interest rate is the free market rate ignores empirical evidence to the contrary. Many economists believe that the natural (or Wicksellian or equilibrium) rate of interest -- the interest rate consistent with full employment without excess inflation -- has been driven below zero by the Great Recession and its aftermath. Such an outcome cannot be achieved by market forces. See, for example, https://www.brookings.edu/blog/ben-bernanke/2015/03/30/why-are-interest-rates-so-low/ and http://www.frbsf.org/economic-research/files/wp2015-16.pdf.
DeleteThe presumption that the market is right is often close to the truth, so it can be a useful shortcut when you don't have time to examine the facts. In this case, the facts clearly refute faith in the market.
Maybe SW-L will tell us but I think there's 2 reasons.
Delete1. It's a long time since the recession and the recovery's crap. It would be valuable to have interest rates at a normal level for when the next recession occurs because it will allow an interest rate cut and not just fiscal stimulus.
2. Trying to pre-empt Conservatives in public debate. People with wealth do not like low interest rates and justifying fiscal stimulus by saying it will allow interest rates to rise is an appeal to the middle class voters.
The usual two observations:
ReplyDelete* You draw the trend line so that it goes from the recession of 1961 to the peak of the bubble in 2008, which seems to me rather biased. If one draws the 1961-2011 (or even 1966-2016) trend line, the bubble years before 2008 stick out as they should, as they were an anomaly.
* At the same time there is a fiscal slowdown, there is a huge credit boom, and asset prices, private debt, immigration, imports, are all growing strong, and as G Osborne said “My approach is to be fiscally conservative but monetarily active”. That looks like the current policy is redistribution to me (and apparently also to Mervyn King), not austerity.
The second point matters a lot, because a question it engenders is whether "growth" is below potential ("austerity", or "growth" is happening in the "wrong" areas ("redistribtion"). For example consider this candid title from the Daily Mail:
http://www.dailymail.co.uk/money/investing/article-4567304/Where-invest-cash-election.html
“Where to invest your cash after the election: Experts tip homebuilders and financials if Tories win”
and from G Osborne:
http://www.independent.co.uk/incoming/inside-westminster-george-osborne-s-housing-boom-will-echo-into-the-future-8869835.html
“Hopefully we will get a little housing boom and everyone will be happy as property values go up,”
Compare with a "red tory" sober summary of the effects of unleashing the forces of neoliberalism for the past 35 years to enable a boom of higher investment and productivity:
https://www.theguardian.com/commentisfree/2017/may/14/theresa-may-victory-must-not-get-in-way-clear-ideology#comment-98534689
“47% of the UK population live in areas as productive as the former East Germany. Outside the south-east, the UK has a massive infrastructure deficit: per head, its just 40% of the OECD average.”
Your trend curve describes a rising growth rate -- about 25% growth between 1961 & 73 and 34% between 2009 & 2021. This gives a much bigger shortfall than than a constant-growth trend would. Why did you choose it?
ReplyDeleteIt looks to me as if SW-L's trend line is growth with an annual rate of 2.1%, which means exponential growth. Isn't it an application of the compound interest formula?
Delete«Your trend curve describes a rising growth rate -- about 25% growth between 1961 & 73 and 34% between 2009 & 2021»
DeleteTo me that looks like a consequence of choosing to assume that 1997-2007 were not a trickle-down ("wealth effect") debt fueled, scottish-oil supported, asset price bubble, but a period of higher growth unleashed by neoliberalism.
Advocates of expansionary monetary policy like, I think, B DeLong seem to me to argue that neoliberalism unleashes higher growth; which is pretty much baked into NeoKeynesian models, where the "microfoundations" bake in the idea that government intervention, except when below "full employement" because of price inflexibilities, reduces growth.
NeoKeynesian models are Real Business Cycle plus bigger debt growth to stimulate "trickle down" via the "wealth effect" whenever below "full employment", which is described as not reaching "potential" growth. So assuming the highest possible "potential" growth" trend line means having finding reasons to advocate faster asset price growth.
And the economy of the UK south-east end London is very much based on more asset stripping thanks to further turns of the debt-collateral spiral fueled by higher collateral prices. The BoE seems absolutely desperate to keep asset stripping going by pushing that spiral ever further.
He could have used a log scale, but many readers have difficulty comprehending log scales.
DeleteI'm fairly sure a log scale on the income axis would have shown that trend to be a line with constant growth per annum.
I rather dislike that he chose household income (he likely chose it to make his easily communicated claim about loss per household) rather than GDP per capita or GDP divided by core working age demographic. I think GDP/capita would be the most usual metric in this case.
The old LSE Phillips Machine is now in The Science Museum and worth a look. I have a flow chart of its working from the time it was made. It was supposed to indicate how Keynes worked etc. I regret that you are all men of the past. There are few around who have a glimmer of what we are in for but even they cannot predict. This is because of the economics of what is to come and what is derived from past figures is very different. We may know a little about the past, but nothing about the future.
ReplyDeleteAnother detailed post at the LRB against the BBC, 'Brittle and Blustering' by Glen Newey 5 June 2017.
ReplyDeleteyes! that's why i call it flat earth economics
ReplyDeleteMainly Macro: still not getting it after all these years.
ReplyDeleteWhat is there to get?
DeleteIs it fair to say, though, that in terms of GDP per capita, the economic performance of the UK over 2010 - 2017 has been no worse than most OECD countries ? Of course, many of those countries are in the Euro, but Sweden and Denmark are not. Have the Nordic countries also fallen victim to pre-Keynesian nonsense ? Is there any country which hasn't ?
ReplyDeleteThanks again to Simon to sharing his expert views in his usual evidenced and clear manner.
ReplyDeleteMy reservation with his focused new keynesism approach is that the purpose of his fiscal stimulus (temporary) is to get interest rates off their lower bound. But what would happen, then? Given the structural parameters of the UK economy and its intrinsic housing double bind, a rise in interest rates would be expected to lead to wobbles in the housing market, and lower consumption at levels that would likely more than offset the impact of the fiscal stimulus; would then that stimulus be maintained?
There needs to a conceptual leap beyond what appears to be new keynesian thinking or dogma: productive public investment needs to be increased to a higher steady state and sustainable level in order to maintain aggregate demand at both a level and composition consistent with
a sustainable full employment equilibrium, allied to supply side changes involving training focused on increasing output per person. The construction industry is a case in point: it would benefit from higher levels of sustained demand linked to increased public infrastuctural investment, conducive to efficient capacity planning and investment; to avoid inflation in labour rates unmatched by improved productivity, its workforce would need to both expand and be more productive.
'We desperately need more public investment and more current spending to boost demand, which in turn will allow interest rates to come away from their lower bound'
ReplyDeleteHow?
Why?
Whilst I agree that we need more public investment, why can't interest rates remain as they are?
Is there any Western country that's not well below its 1961-2008 growth trend? I suppose Turkey is above, but it's not really Western and certainly wasn't at the forefront of technology for most of the period.
ReplyDeleteI'd be very interested to see the results (honestly: executive summary) of a study comparing growth trends and recent slump throughout OECD and its causes. I have a suspicion that slowing technological progress explains much, and was merely pushed into the background by the obvious and spectacular economic crises.
The rate of technological progress had noticeably slowed from the 60's to the 90's already, which was in part covered up by changes in employment, particularly of women.
Boom!
DeleteYou write that the total cumulated cost of austerity, from a conservative OBR assessment, is given as 5% of GDP (1+2+2). Forgive what I assume to be an stupid question, but how does one arrive to those numbers? I'm looking at chart 2.9 pp 16 of the report, isn't that saying that their estimate is only about 1% GDP decrease for 2010-11 and 2011-12?
ReplyDeleteI suppose Prof. Wren-Lewis is summing up the cumulative negative effect. That is,
Delete2010-11 negative effect=1 cumulative negative effect=1
2011-12 negative effect=1 cumulative negative effect=2
2012-13 negative effect=0 cumulative negative effect=2
So the sum of cumulative negative effect becomes 1+2+2=5.
(Actually, he explained this in 6 January 2015 post).
Ooh, I see now. Thank you for your reply.
Delete