Winner of the New Statesman SPERI Prize in Political Economy 2016


Showing posts with label current accounts. Show all posts

Saturday, 13 October 2018

Implications of German export success


I have finally got around to reading this excellent CEPR ebook on Germany’s exceptional recovery. That German GDP growth since the Global Financial Crisis (GFC) is higher than average Eurozone growth or French growth can be seen below.

GDP growth (source OECD Economic Outlook)

However the relative performance in terms of unemployment is remarkable.

Unemployment (national definitions, source OECD Economic Outlook)

The tremendous success in reducing unemployment is discussed in two papers in the book, and both suggest that it had more to do with changes in the nature of firm-union bargaining than the Hartz reforms. (John Springford has a nice chart showing how the German Phillips curve has shifted.) I have for some time noted how wage increases in Germany after 2000 were too low in the context of a 2% inflation target, and this helped drive an export boom and is a factor behind a huge current account surplus of 8% of GDP.

Other chapters in the ebook argue that there were other, perhaps as or more important,  factors behind this export boom, and I’m convinced that other factors did play a role. However the point I want to make in this post is that, as long as these factors are permanent, they imply that the real exchange rate in Germany has to rise at some point. This is exactly the same point as saying that not all of the German current account surplus of 8% is structural. Some of that surplus is because the German real exchange rate is undervalued.

There are two ways the German real exchange rate can appreciate. The first is via an appreciation in the Euro, and the second is for German inflation to be higher than average Euro area inflation. Below is a chart of one measure of competitiveness for both Germany and the Euro area.

The level is arbitrary: it is how the two series move over time and relative to each other that matters. You can see how Germany gained competitiveness.over other Eurozone countries from 2000 to the GFC. You can also see how that gain has been partially but not fully unwound over the last 7 or 8 years. Looking at Euro area competitiveness, it is a little below its average level over the past and also its level in 2010 when I calculated it was close to its equilibrium rate to the dollar. (This work was unpublished, but uses a similar model to the one I used to calculate the optimal entry rate of Sterling into the Euro as part of the 5 tests.)

So there is perhaps some scope for a further appreciation in the Euro, but it seems unlikely that will be enough on its own to achieve the required German real appreciation. German nominal wages have increased by more than the Euro average in recent years, but the differences have been small. That difference needs to increase to get Germany's real exchange rate to sustainable levels. Germany should not think of that as a problem, but rather the way their export success has to be translated into higher incomes for German workers..


Friday, 14 July 2017

Why German wages need to rise

An interesting disagreement occurred this week between Martin Sandbu and the Economist, which prompted a subsequent letter from Philippe Legrain (see also Martin again here). The key issue is whether the German current account surplus, which has steadily risen from a small deficit in 2000 to a large surplus of over 8% of GDP, is a problem or more particularly a drag on global growth.

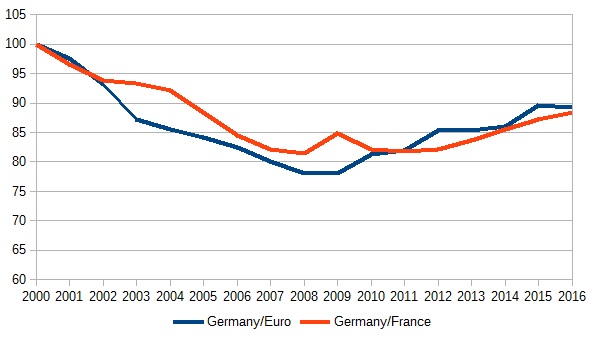
To assess whether the surplus is a problem, it is helpful to discuss a key reason why it arose. I have talked about this in detail many times before, and a similar story has been told by one of the five members of Germany’s Council of Economic Experts, Peter Bofinger. A short summary is that from the moment the Eurozone was born Germany allowed wages to increase at a level that was inconsistent with the EZ inflation target of ‘just below 2%’. We can see this clearly in the following chart.

Relative unit labour costs, source OECD Economic Outlook, 2000=100

The blue line shows German unit labour costs relative to its competitors compared to the same for the Euro area average. Obviously Germany is part of that average, so this line reduces the extent of any competitiveness divergence between Germany and other union partners. By keeping wage inflation low from 2000 to 2009, Germany steadily gained a competitive advantage over other Eurozone countries.

At the time most people focused on the excessive inflation in the periphery. But as the red line shows, this was only half the story, because wage inflation was too low in Germany compared to everyone else. This growing competitive advantage was bound to lead to growing current account surpluses.

However that in itself is not enough to say there is a problem, for two related reasons. First, perhaps Germany entered the Eurozone at an uncompetitive exchange rate, so the chart above just shows a correction to that. Second, perhaps Germany needs to be this competitive because the private sector wants to save more than it invests and therefore to buy foreign assets.

There are good reasons, mainly to do with an ageing population, why the second point might be true. (If it was also true in 2000, the first point could also be true.) It makes sense on demographic grounds for Germany to run a current account surplus. The key issue is how big a surplus. Over 8% of GDP is huge, and I have always thought that it was much too big to simply represent the underlying preferences of German savers.

I’m glad to see the IMF agrees. It suggests that a current account surplus of between 2.5% to 5.5% represents a medium term equilibrium. That would suggest that the competitiveness correction that started in 2009 has still got some way to go. Why is it taking so long? This confuses some into believing that the 8% surplus must represent some kind of medium term equilibrium, because surely disequilibrium caused by price and wage rigidities should have unwound by now. The answer to that can also be found in an argument that I and others put forward a few years ago.

For this competitiveness imbalance to unwind, we need either high wage growth in Germany, low wage growth in the rest of the Eurozone, or both. Given how low inflation is on average in the Eurozone, getting below average wage inflation outside Germany is very difficult. The reluctance of firms to impose wage cuts, or workers to accept them, is well known. As a result, the unwinding of competitiveness imbalances in the Eurozone was always going to be slow if the Eurozone was still recovering from its fiscal and monetary policy induced recession and therefore Eurozone average inflation was low. [1]

In that sense German current account surpluses on their current scale are a symptom of two underlying problems: a successful attempt by Germany to undercut other Eurozone members before the GFC, and current low inflation in the Eurozone. To the extent that Germany can make up for their past mistakes by encouraging higher German wages (either directly, or indirectly through an expansionary fiscal policy) they should. Not only would that speed adjustment, but it would also discourage a culture within Germany that says it is generally legitimate to undercut other Eurozone members through low wage increases. [2]

From this perspective, does that mean that the current excess surpluses in Germany are a drag on global growth? Only in a very indirect way. If higher German wages, or the means used to achieve them, boosted demand and output in Germany then this would help global growth. (Remember that ECB interest rates are stuck at their lower bound, so there will be little monetary offset to any demand boost.) The important point is that this demand boost is not so that Germany can help out the world or other union members, but because Germany should do what it can to correct a problem of its own making.

[1] Resistance to nominal wage cuts becomes a much more powerful argument for a higher inflation target in a monetary union where asymmetries mean equilibrium exchange rates are likely to change over time.

[2] The rule in a currency union is very simple. Once we have achieved a competitiveness equilibrium, nominal wages should rise by 2% (the inflation target) more than underlying national productivity. I frequently get comments along the lines that setting wages lower than this improves the competitiveness of the Eurozone as a whole. This is incorrect, because if all union members moderate their wages in a similar fashion EZ inflation would fall, prompting a monetary stimulus to bring inflation back to 2% and wage inflation back to 2% plus productivity growth.    

Tuesday, 10 November 2015

More on UK interest and exchange rates

A lot of stuff written on UK interest rates reasons as follows. Many estimates of the UK’s output gap - the difference between actual output and the level of output that is consistent with steady (domestically generated) inflation - suggest it is almost zero. That cannot be consistent with nominal short term interest rates as low as 0.5%. Therefore a rise in interest rates is long overdue.

This ignores the rest of the world. Although the OECD estimate that the UK output gap in 2015 is zero, they also estimate it is nearly -2% for the OECD as a whole and nearly 3% for the Euro area. That means the UK is selling less goods abroad. For the UK output gap to be zero, we therefore need some other element of UK aggregate demand to take up the slack created by low exports. It is not government spending, which is going in the opposite direction. So it is consumers and firms that have to be encouraged to borrow more and save less. To put it another way, they need to be encouraged to shift spending from the future to the present. That means lower than normal UK real interest rates.

It is still true that monetary policy should be easier in the Eurozone than in the UK, but with active QE it already is. The fact that markets expect UK interest rates to rise well before those in the Eurozone intensifies the exports problem, because it means that exports are being hit not just by low demand but also by becoming less competitive as sterling appreciates against the Euro. [1]

The problem of low demand for UK exports would be made worse still if, as I suspect, sterling is overvalued even after you allow for differences in expected interest rates. Philip Lane, soon to become governor of the Irish central bank, has produced an interesting analysis of the recent deterioration in the UK current account. He concludes that “financial engineering may have played some role”. I suspect he is right, mainly because he is a renowned expert on these matters. However I wanted to stress that my arguments about overvaluation owed nothing to this recent deterioration.

The UK’s trade balance deficit has remained large and fairly constant for many years, despite the depreciation around 2008. That was not offset by investment income, even before the recent deterioration, which is why we have been running current account deficits for over 15 years. There may be good reasons why some countries run deficits for a long period of time, but it is not obvious whether any of these reasons apply to the UK, and those deficits in themselves mean that the equilibrium exchange rate will be depreciating alongside those deficits.

So we should not expect UK real interest rates to return to their ‘normal’ level until output gaps are closed in the rest of the world. We should also note that the Bank thinks that the normal or natural level of real interest rates is much less than it has been in the past (secular stagnation). Finally with inflation currently low, low real interest rates imply low nominal rates. All this would be true even if you were certain that the current UK output gap was zero, which I am not.

[1] Using UIP, the current real exchange rate is determined by the medium term equilibrium rate (calculated at zero output gaps everywhere) plus expected real interest rate differentials.

Saturday, 9 November 2013

Medium term exchange rates and current accounts

For teachers and students of macroeconomics

This is about how real exchange rates are determined in the medium term. So we abstract from the complications caused by sticky prices and monetary policy. However as anyone who understands uncovered interest parity knows, exchange rates in the short run depend crucially on expectations about medium term exchange rates, so the determination of medium term exchange rates is important whatever your time horizon.

The framework I use when teaching at masters level is the ‘new open economy’ (NOEM) approach, associated with Obstfeld and Rogoff in particular. A classic survey is by Philip Lane. If this framework could be summed up in one sentence, it would be this. In a world where most international trade takes place in goods sold in imperfectly competitive markets, the real exchange rate moves to equate the demand and supply for domestically produced output. [1] What follows is not about whether that framework is empirically useful, but why teaching it can avoid some confusions and pitfalls.

This concept was not of course invented by NOEM. John Williamson’s approach to determining equilibrium exchange rates, later taken up by the IMF and others, is based on the same idea. (See this earlier post for references. Williamson's work can in turn be seen as a development of the 'Swan diagram'.) Indeed I sometimes get annoyed that the NOEM literature typically ignores its antecedents. However one source for confusion is that the essentially empirical literature associated with Williamson focuses on the current account, rather than the supply and demand for domestic output. It does this because the current account is a readily available indicator of this supply and demand balance much of the time. But not always, as the following classic example shows.

Suppose an economy discovers a finite natural resource, like oil, which takes a negligible amount of labour to extract.[2] It takes a few years before the discovery leads to the resource being extracted, but the extent of the resource is common knowledge. This is a standard exercise in consumption smoothing. Consumption rises the moment the resource is discovered, anticipating higher future income. This leads to a current account deficit until the resource is extracted. Once it starts being extracted, consumers are now consuming less than their income, first to pay off their borrowing, and then to save for the day the resource runs out. So while the resource is extracted we get a current account surplus.

What happens to the real exchange rate? If we focus on the current account, we might be tempted to say that it first depreciates, and then appreciates when we have a surplus. This would be wrong. We could start with a special and highly unrealistic case, where there are no non-traded goods, the economy is so small that only a negligible amount of the additional consumption is spent on home produced goods, and labour supply is fixed. In that case nothing would happen to the real exchange rate at any time. More realistically, transport costs will mean there is some ‘home bias’ in consumption, and also some of the consumption will go on domestically produced non-traded goods. Both imply a domestic real appreciation, which begins while the current account is in deficit, and which stays the same as the current account switches to surplus.[3] In addition, if consumers want to match higher consumption with more leisure, labour supply will decrease, and we get an appreciation to choke off demand for domestically produced goods. Again this happens throughout, and not just when the resource is extracted.

The reason why looking at the current account is misleading is that we are ignoring the capital account. Before the resource is extracted, consumption rises through borrowing from abroad. If all the extra consumption is on overseas goods, those lending to consumers require no domestic currency (they can lend in dollars). But if some of the additional consumption is spent domestically, some of the lending must also be in domestic currency, so we get an appreciation. Once the resource begins to be sold (for dollars), it is as if all the extra income is used to buy overseas assets. So the size of the appreciation remains unchanged.

Thinking about both current and capital accounts in this situation is tricky, but thinking about the supply and demand for the domestically produced tradable goods gives us the same answer much more easily.


[1] In a simple model without capital, supply is just labour supply and productivity. For a small open economy where there are no non-traded goods or home bias, demand for domestically produced goods just depends on world output and competitiveness=real exchange rate. In this simple set-up a consumer price based real exchange rate is constant (PPP holds), but once we introduce realistic features like home bias or non-traded goods competitiveness influences a consumer price based real exchange rate, and PPP no longer holds.

[2] For simplicity ignore the capital required to extract the resource, and we assume all the income from the resource goes to domestic consumers.

[3] The two mechanisms work in different ways, however. The additional demand for non-traded goods takes labour away from traded goods production, so reduced traded goods supply leads to an appreciation. With home bias we get an appreciation because of the additional demand for domestically produced traded goods.


Thursday, 2 August 2012

Currency Misalignments and Current Accounts


One of my favourite journal paper titles is Xavier Sala-i-Martin’s AER paper ‘I just ran two million regressions’. The problem that paper tries to deal with is that there are too many potential variables that you could conceivably put in an equation explaining differences in economic growth rates among countries. There is then a serious danger of (intentional or otherwise) data mining. A researcher may want to establish that their pet new variable is important in determining growth, so they try lots of different regressions. When one set of additional variables are included the pet new variable is significant, but when another set is used it is not. Only the first group of regressions are published. Sala-i-Martin’s paper uses techniques that involve looking at all possible permutations of variables, in order to try and assess which are robust, in the sense of tending to be significant whatever else is in the regression.  

A recent ECB working paper by Ca’Zorzi, Chudik and Dieppe does something similar with models of the medium term current account. Why is this important? In my view it’s a key ingredient in being able to say something about exchange rate misalignments. This idea is associated in particular with the work of John Williamson, who christened the approach Fundamental Equilibrium Exchange Rates, or FEER for short. (That led to probably the best title of any of the papers I have co-authored – ‘Are Our FEERs justified’ – where we test the FEER approach against PPP[1].) John’s most recent analysis, co-authored with William Cline, can be found here. This or very similar approaches often go by different names: in Peter Isard’s nice survey it is called the macroeconomic balance approach, and it continues to be used (along with other methods) by the IMF.

The idea behind the FEER approach is to model trade flows as a function of the real exchange rate and activity levels. In the medium term activity levels will be determined from the supply side i.e. the output gap will tend to zero. So if we think we know about this supply side, and we know what the current account will be in the medium term, we can back out the medium term real exchange rate. We can then form a view about the extent to which current exchange rates are misaligned (or, more precisely, what expected interest rate differentials would have to be to justify current exchange rates). I’ve used this approach on a number of occasions in the past: perhaps most notably, to try and assess what Euro/Sterling exchange rate the UK should have entered the EuroZone at if it had decided to join in 2003.

The main problem with this approach is working out what the medium term current account should be. Actual current accounts are a poor guide, because they are influenced by both noise and short term factors, like the economic cycle and currency misalignment. In long term equilibrium it is reasonable to assume that the current account should be zero, because the current account is the change in national wealth. However we know that current accounts can show persistent surpluses or deficits over many years. Intertemporal consumption theory gives us some ideas, but on its own it is not that helpful. Many other factors may matter, such as countries having different demographic profiles.  With no clear encompassing theory to use, empirical studies of the kind cited above may be our best guide.

Incidentally, the New Open Economy Macro (NOEM) approach, which is currently the most widely used microfounded open economy framework, essentially uses the same idea as the FEER: see for example this study by Obstfeld and Rogoff. It is more concerned with microfoundations, and less with data, but it shares with the FEER approach a focus on imperfectly competitive markets for internationally traded goods. As far as I know these authors have never acknowledged Williamson as a precursor, and I’m not sure why. As a result, many macroeconomists think NOEM invented this way of thinking about medium term exchange rates.

The details of which variables the authors of the ECB study find are important in determining medium term current accounts are probably not of wide enough interest to discuss in this post. What is more topical is that they use their robust models to estimate what underlying current accounts currently are for the US, UK, Japan and China. Perhaps unsurprisingly they find that, although the US would be in deficit and China in surplus, the numbers are much smaller than the deficits and surpluses observed in the recent past. More controversial, perhaps, is that they find Japan should also be running a deficit. In the past I and others have tended to assume surpluses for Japan, but this was always partly based on demographic features which were coming to an end, which is maybe what has now happened.

One slightly disappointing aspect of the study is that they did not look at Germany. There is some debate about the extent to which German surpluses represent a temporary misalignment of real exchange rates within the Eurozone, or whether they may be partly structural. The answer is rather important in assessing the extent to which deflation is required outside Germany, and it would have been very interesting to know what this study had to say on this issue.                   


[1] I should add that I take no credit for the title - I think it came from Rebecca.

Tuesday, 6 March 2012

The Other Eurozone Crisis

                What follows is not a new story: many people have argued that the problems of the Eurozone are as much about private sector expansion, current account imbalances and misalignment, as they are about excessive debt. What follows is an attempt to present this argument in as clear and convincing a way as possible, and say why this matters.
One of the central pieces of macro I teach undergraduates is an adaptation of the Swan diagram. For non-economists this simply plots a demand curve and a supply curve in national competitiveness and output space. As competitiveness improves, exports increase and imports fall, because the demand for domestic output rises. More technically, it describes an economy made up of producers of differentiated traded goods sold in imperfectly competitive markets, so the aggregate demand curve has an obvious interpretation. I draw the supply curve downward sloping following the textbook I use, but it could equally well be vertical.
Here is the diagram applied to the periphery and some quite central Eurozone economies.

The formation of the Eurozone led to substantial monetary easing in these economies, partly because financial markets wrongly thought that they were subject to risk levels not much different from Germany. The following table looks at two measures of real interest rates (long and short). I’ve missed off 1998-9 because entry was anticipated, so it is not clear where to put these years. I’ve taken current (CPI) inflation away from nominal rates, but hopefully with averages like these using actual rather than expected inflation is not too great a sin. Data is taken from OECD Economic Outlook.


Average Real Interest rates in the Eurozone

Short (%)


Long (%)


1990-97
2000-07
2008-11
1990-97
2000-07
2008-11
Germany
3.6
-0.7
-0.5
4.4
2.6
1.5
France
5.1
-0.8
-0.2
5.4
2.4
1.8
Italy
5.7
-1.1
0.4
6.6
2.2
2.4
Greece
18.4
-2.0
3.8


Ireland
4.7
-2.4
4.0
4.4
0.9
6.1
Portugal
5.4
-1.8
2.4
7.4
1.5
4.4
Spain
5.7
-2.1
0.3
6.0
1.2
2.3
Euro
4.3
-1.1
0.0


Real interest rates fell everywhere in the 2000-7 period (global savings glut?), but the fall was more modest in Germany than anywhere else. Lower real interest rates shift the AD curve to the right. With sticky prices we initially move horizontally from the 2000 point to the new demand curve (competitiveness changes slowly). However, as we are to the right of the supply curve, we get inflation and a loss of competitiveness until we reach 2007. From this date onwards country specific risk begins to return, and the aggregate demand curve shifts back. We need to go back to something like the 2000 position, which requires a recession and an internal devaluation to restore competitiveness. Different countries are at different stages in this process. The country which is furthest on the road back to a sustainable position is probably Ireland (although there are some statistical problems), but in others the process is only just beginning. Given low inflation in Germany, and the difficulty of cutting nominal wages, this road may be particularly painful and long.
Are the falls in real interest rates shown above enough to explain the loss in competitiveness seen in most Eurozone countries relative to Germany? It could be that in many periphery countries, particularly those that experienced housing booms, the key factor was a shift in risk perceptions. This shift could have been triggered by lower interest rates themselves (as some have argued for other countries like the US), or other financial supply side factors (see here, but also here).  Which is true may be important because it is related to how sustainable the original shift in the AD curve was. In theory a persistent reduction in real interest rates could lead to a prolonged shift in the demand curve, and reduced competitiveness, with no reversal of the sort shown in this chart. This is equivalent to asking how sustainable are the pattern of current account deficits and surpluses that emerged in the Eurozone in 2007. As I argued here, the balance of evidence suggests that these imbalances were unsustainable. Here are current accounts over this period.

Eurozone Current Accounts (as % GDP)

The Eurozone position as a whole (not shown) has hardly changed. The swing to surplus in Germany after 2000 is dramatic. Although the current account positions in France and Italy have deteriorated, this is not nearly as large as the deterioration in the smaller countries. This may also be an indication that in the smaller countries the demand stimulus generated by lower interest rates may have been much greater (the rightward shift in the AD curve larger), perhaps caused by excessive risk taking (housing bubbles etc).
This story is all about monetary conditions. Monetary easing was greater in the periphery countries when the Euro was created, partly because policy had been tighter there before Eurozone entry, and partly because risk premiums disappeared. If you look at fiscal policy, on the other hand, you find no comparable pattern. Overall fiscal policy, as measured by underlying deficits calculated by the OECD, became a little tighter in the Eurozone as a whole over the 2000-7 period. As the Chart below shows, Spain actually tightened quicker than this average, and fiscal policy was broadly unchanged in Ireland and Portugal. Even in Greece, the story is more a gradual reversion to previous bad old ways, after a pre-entry tightening. So the shift in the AD curve was not, with the exception of Greece, a result of a fiscal expansion.

Eurozone Fiscal Positions (Underlying deficit as % GDP, OECD Economic Outlook)

This does not imply that fiscal policy was appropriate in those countries over this period. I argued in an earlier post that fiscal policy should have been much tighter, to offset the monetary stimulus. But it is important to distinguish between what actually happened (a monetary stimulus) and what might have been (countercyclical fiscal policy).
                This is a story about monetary conditions and aggregate demand. Of course it is possible in theory that reduced competitiveness relative to Germany could represent some sort of wage push. However, the strong growth experienced in these countries on Euro entry is consistent with the diagram above, and is less consistent with a cost-push shock. In addition, the labour share has not shown any marked increase in most Eurozone economies over this period (see here). The fact that wages rose ahead of productivity outside Germany reflects relative demand conditions (see here). None of this takes away from the need to deal with underlying structural problems in many of these countries – it just says demand shocks can occur, and in a monetary union their impact can be substantial and persistent. This is a very familiar story in terms of both the historical experience of fixed exchange rate regimes and the academic literature.
                This analysis tells us why many Eurozone countries would be in recession today, even if there had been no debt crisis. Why is this important? After all, the debt crisis is real enough, and the implications – recession in many Eurozone countries – are the same. It is important because it pinpoints the nature of the fundamental policy error that was made in the Eurozone. It was not that the Stability and Growth Pact (SGP) was ineffective – it was, but this did not lead to excessive fiscal expansion (Greece excepted) as the table above shows. The problem with the SGP was that it ignored countercyclical fiscal policy. (I argue here that the SGP’s focus on deficits actually encouraged governments not to do the right thing.) If countries had responded to their deteriorating competitiveness position relative to Germany by tightening fiscal policy, the unsustainable shift in the AD curve shown above would have been at least reduced in size. In addition, the market’s fear about fiscal sustainability would have been greatly reduced. On both counts we might have avoided recession today.
                The really sad thing is that the Eurozone is continuing to make the same mistake. Such a collective failure by policy makers is really difficult to comprehend, although I will discuss in a later post how this may be related to economic orthodoxy in Germany.